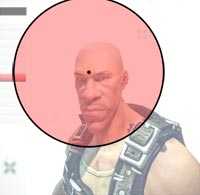
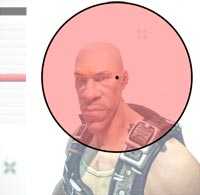
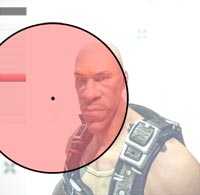
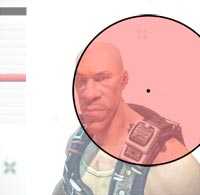
At the risk of encouraging you, I’ll try to explain. I am assuming that in each diagram the circle is the flat end of a cone with its tip at the gun barrel. They represent the maximum possible spread for bullet N (at time X after firing).
The probability that the bullet hits the circle is 1 (a sure thing). The probability of hitting the legs, for example, is zero because they lie outside the circle. The probability of hitting the head is… somewhere between 1 and 0. The probability distribution will likely be different for each bullet since the spread appears to increase as the trigger is held down.
In addition you’ve got the problem of how to model the recoil. It obviously affects where the bullets go, but it can be compensated for by the player. As an initial guess you could perhaps assume no player compensation, which might be reasonable if you were modelling the first few shots of tap fire.
Does anyone have any figures for how the bullet trajectories were calculated in ETQW? (since that had a nice balance for pub play IMO) I suppose I could always look at the RTCW source code if I was really interested